

Options Trading Strategies: Covered Straddle
The covered straddle is a three-legged strategy, created by buying (or owning) the underlying security and selling one At The Money call and one At The Money put, both with the same expiration date and a strike price.
You can look at a covered straddle as a combination of the covered call strategy and a naked put.
When to use this strategy?
You own BTC/ETH and are bullish and you want to hodl. You can also use this strategy if you want to increase the income of the covered call with a premium of the additional short put.
Below is a Profit and Loss chart example of a covered straddle options strategy:
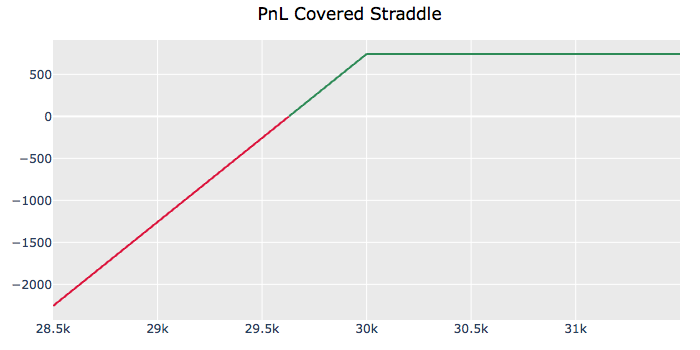
Pros:
Generate an income from options premium. Higher income than covered call.
Cons:
Uncapped risk and capped maximum profit. Small reward relative to the capital you have spent to create the position.
Example:
In this example, BTC is trading at 43,492.50 USD. You have bought a BTC at 43,636.00 USD, sold an ATM putwith a strike price of 44,000.00 USD, and sold an ATM call with the same strike, both with an expiration date of February 11th 2022. You have received a premium of 1,596.39 USD. However, this is a net debit strategy because you paid for the BTC, so you have the initial costs.
The Profit and Loss chart is given below:
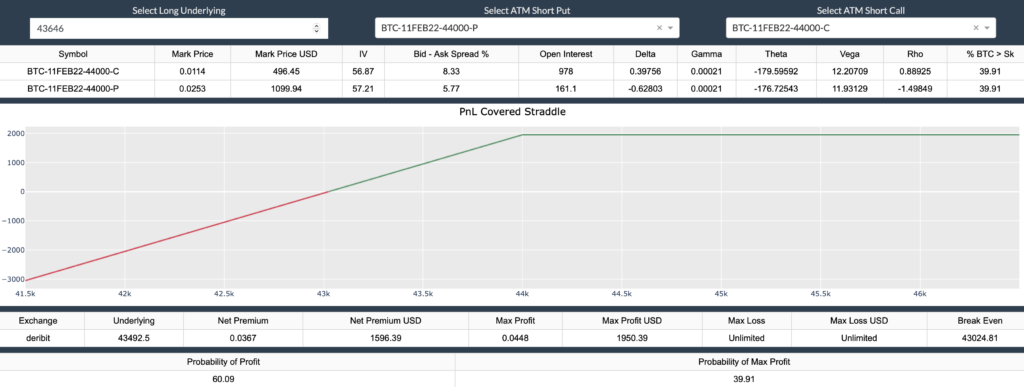
Upon expiration:
If the BTC price is below the strike price, call expires worthless, a put is exercised, and you are obligated to buy more BTC at the strike price, and your maximum loss is unlimited.
You are in the profit as long as the BTC price is above the break even price.
If the BTC price is above the strike at expiration, a put expires worthless and a call is exercised, and you are at your maximum profit which is equal to strike price minus the price you have paid for BTC plus the net premium.
| BTC at Expiry (USD) | Payoff (USD) |
|---|---|
| 41,757.00 | -2,535.61 |
| 42,267.00 | -1,515.61 |
| 42,567.00 | -893.61 |
| 42,923.00 | -203.61 |
| 43,024.81 (break even) | 0 |
| 43,147.00 | +298.39 |
| 43,504.00 | +958.39 |
| 43,927.00 | +1,804.39 |
| 44,000.00 (ATM strike) | +1,950.39 (max profit) |